Appearance
什么是 sysdig?
sysdig 是一个 Linux 系统诊断工具,并且提供了对容器的原生支持。可以认为它涵盖了 strace + tcpdump + htop + iftop + lsof + ... 等一系列系统工具的功能。
相比于其它工具,sysdig 的优势在于:
- 功能强大,并且使用方法和输出格式统一,无需使用不同的命令在不同的输出格式之间进行转换
- 云原生支持,可以对容器和 k8s 集群进行监控
安装
shell
$ curl -s https://s3.amazonaws.com/download.draios.com/stable/install-sysdig | sudo bashsysdig 输出
默认输出
默认可以直接执行
shell
# 需要 root 权限
$ sudo sysdig
34378 12:02:36.269753803 2 echo (7896) > close fd=3(/usr/lib/locale/locale-archive)
34379 12:02:36.269754164 2 echo (7896) < close res=0
34380 12:02:36.269781699 2 echo (7896) > fstat fd=1(/dev/pts/3)
34381 12:02:36.269783882 2 echo (7896) < fstat res=0
34382 12:02:36.269784970 2 echo (7896) > mmap
34383 12:02:36.269786575 2 echo (7896) < mmap
34384 12:02:36.269827674 2 echo (7896) > write fd=1(/dev/pts/3) size=12
34385 12:02:36.269839477 2 echo (7896) < write res=12 data=hello world.
34386 12:02:36.269843986 2 echo (7896) > close fd=1(/dev/pts/3)
34387 12:02:36.269844466 2 echo (7896) < close res=0
34388 12:02:36.269844816 2 echo (7896) > munmap
34389 12:02:36.269850803 2 echo (7896) < munmap
34390 12:02:36.269851915 2 echo (7896) > close fd=2(/dev/pts/3)
34391 12:02:36.269852314 2 echo (7896) < close res=0
默认的输出格式为:
*%evt.num %evt.time %evt.cpu %proc.name (%thread.tid) %evt.dir %evt.type %evt.args其中:
- evt.num 是一个递增的序号
- evt.time 是事件的发生时间
- evt.cpu 是事件的cpu序号
- proc.name 是进程名称
- thread.top 是线程 id
- evt.dir 是事件方向,> 为进入事件,< 为退出事件
- evt.type 是事件类型,例如 read,open,write 等
- evt.args 是事件参数列表
输出到文件
默认输出是在 terminal,可以将输出保存到文件中,然后 sysdig 再加载文件来进行分析。
shell
# sysdig 输出到文件
$ sudo sysdig -w dump.scap

# rotation 参考 https://sysdig.com/blog/sysdig-continuous-capture-with-file-rotation/
# 例如每个文件大小为 1M,保留最新的 5 个文件
$ sudo sysdig -C 1 -W 5 -w dump.scap

# 读入文件
$ sysdig -r dump.scap
可以参考 Sysdig Continuous Capture with File Rotation 查看更多输出到文件的示例。
格式化输出
通过 sysdig -j 可以输出 JSON 格式,例如:
shell
$ sudo sysdig -j
{"evt.cpu":1,"evt.dir":">","evt.info":"next=0 pgft_maj=0 pgft_min=1385 vm_size=229324 vm_rss=15784 vm_swap=0 ","evt.num":7,"evt.outputtime":1607781847452944277,"evt.type":"switch","proc.name":"sysdig","thread.tid":14550}
{"evt.cpu":0,"evt.dir":">","evt.info":"interval=4000000(0.004s) ","evt.num":8,"evt.outputtime":1607781847453039462,"evt.type":"nanosleep","proc.name":"falco","thread.tid":12073}
{"evt.cpu":0,"evt.dir":">","evt.info":"next=0 pgft_maj=70 pgft_min=3664 vm_size=407148 vm_rss=36156 vm_swap=4596 ","evt.num":9,"evt.outputtime":1607781847453046982,"evt.type":"switch","proc.name":"falco","thread.tid":12073}
{"evt.cpu":1,"evt.dir":">","evt.info":"next=14550(sysdig) pgft_maj=0 pgft_min=0 vm_size=0 vm_rss=0 vm_swap=0 ","evt.num":10,"evt.outputtime":1607781847453471349,"evt.type":"switch","proc.name":null,"thread.tid":0}
{"evt.cpu":1,"evt.dir":">","evt.info":"next=14549(head) pgft_maj=0 pgft_min=1389 vm_size=229324 vm_rss=15784 vm_swap=0 ","evt.num":24,"evt.outputtime":1607781847453669133,"evt.type":"switch","proc.name":"sysdig","thread.tid":14550}
通过 sysdig -p <format> 可以自定义输出格式,例如:
shell
$ sudo sysdig -p"user:%user.name dir:%evt.arg.path"
user:messagebus dir:/usr/share/dbus-1/system-services/org.freedesktop.nm_dispatcher.service
user:messagebus dir:/usr/share/dbus-1/system-services/org.freedesktop.Avahi.service
user:messagebus dir:/usr/share/dbus-1/system-services/org.freedesktop.UPower.service
user:messagebus dir:/usr/share/dbus-1/system-services/fi.w1.wpa_supplicant1.service
user:messagebus dir:/usr/share/dbus-1/system-services/org.freedesktop.ModemManager1.service
user:messagebus dir:/usr/share/dbus-1/system-services/org.freedesktop.RealtimeKit1.service- 变量前面需要添加
% - 默认情况下,只有在所有变量都存在的情况下才会打印出来啊。如果需要允许字段不存在,使用
*%user.name类似格式,即前面加一个*,此时不存在的字段会打印出<NA>
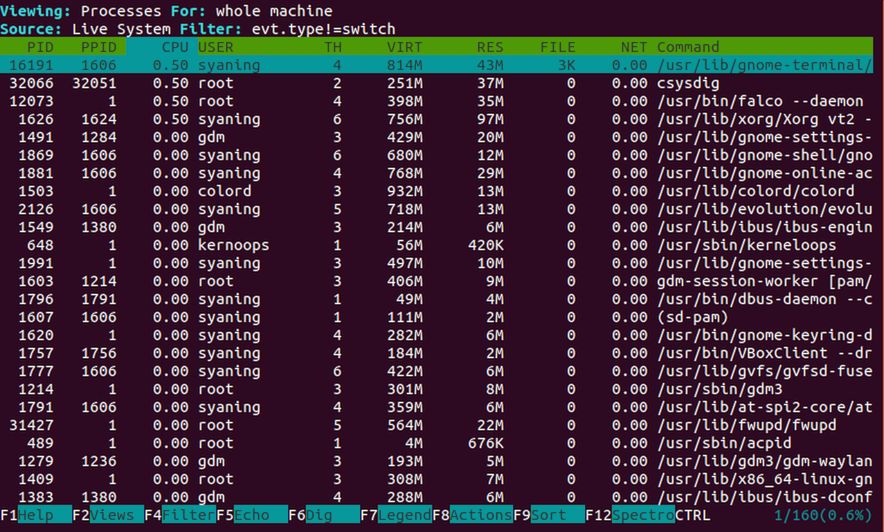
csysdig
通过 sudo csysdig 可以查看图形化的展示,类似于 top 命令看到的效果,如图所示:
Filter
sysdig 提供了强大的过滤功能,用来进行筛选。例如:
shell
sudo sysdig proc.name=cat

sudo sysdig proc.name=cat and evt.type=read
操作符支持:=,!=,<,<=,>,>=,contains,icontains,in,exists 逻辑操作支持:and,or,not
通过 sysdig -l 可以查看所有支持的 filter,有如下几类:
- fd
- process
- evt
- user
- group
- syslog
- container
- fdlist
- k8s
- mesos
- span
- evtin
Chisels
sysdig chisel 是 Lua 编写的脚本,可以用来对事件进行分析。通过 sysdig -cl 可以查看 chisesl 列表。主要有以下几类:
- Application
- CPU Usage
- Errors
- I/O
- Logs
- Misc
- Net
- Performance
- Security
- System State
- Tracers
通过 sysdig -i <chiselnaame> 可以查看 chisel 信息,通过 sysdig -c <chiselname> [args] 可以运行一个 chisel。例如:
shell
$ sysdig -i ps
Category: System State
----------------------
ps              List (and optionally filter) the machine processes.

List the running processes, with an output that is similar to the one of ps. Ou
tput is at a point in time; adjust this in the filter. It defaults to time of e
vt.num=0
Args:
[filter] filter - A sysdig-like filter expression that allows r
                estricting the FD list. For example 'fd.name contains /etc' sho
                ws all the processes that have files open under /etc.

$ sudo sysdig -c ps proc.name=bash
TID     PID     USER      VIRT       RES        FDLIMIT   CMD
16201   16201   admin     29.26M     5.61M      1024      bash
20480   20480   admin     29.26M     5.59M      1024      bash
云原生支持
sysdig 对云原生场景有很好的支持,Filter 包含 container 和 k8s,例如:
shell
$ sudo sysdig container.name=nginx
1 23:12:55.568063000 0 container:eda15d667287 (-1) > container json={"container":{"Mounts":[],"cpu_period":100000,"cpu_quota":0,"cpu_shares":1024,"cpuset_cpu_count":0,"created_time":1607784243,"env":[],"full_id":"eda15d667287f94c26fde54f725f63b348f932455f2af80fdf6a3ae3eb70a04f","id":"eda15d667287","image":"nginx:1.17-alpine","imagedigest":"sha256:763e7f0188e378fef0c761854552c70bbd817555dc4de029681a2e972e25e30e","imageid":"89ec9da682137d6b18ab8244ca263b6771067f251562f884c7510c8f1e5ac910","imagerepo":"nginx","imagetag":"1.17-alpine","ip":"172.17.0.2","is_pod_sandbox":false,"labels":{"maintainer":"NGINX Docker Maintainers <docker-maint@nginx.com>"},"lookup_state":1,"memory_limit":0,"metadata_deadline":0,"name":"nginx","port_mappings":[{"ContainerPort":80,"HostIp":0,"HostPort":8080}],"privileged":false,"swap_limit":0,"type":0}}

94652 23:13:04.245968331 1 nginx (14766) < epoll_pwait
94653 23:13:04.245981938 1 nginx (14766) > accept flags=0
94654 23:13:04.245987609 1 nginx (14766) < accept fd=7(<4t>172.17.0.1:47566->172.17.0.2:80) tuple=172.17.0.1:47566->172.17.0.2:80 queuepct=0 queuelen=0 queuemax=511
94655 23:13:04.245994319 1 nginx (14766) > epoll_ctl
94656 23:13:04.245996892 1 nginx (14766) < epoll_ctl
94657 23:13:04.245998144 1 nginx (14766) > epoll_pwait
94658 23:13:04.246001866 1 nginx (14766) > switch next=15088(curl) pgft_maj=0 pgft_min=153 vm_size=6420 vm_rss=1868 vm_swap=0
94681 23:13:04.246077541 1 nginx (14766) < epoll_pwait
94682 23:13:04.246081494 1 nginx (14766) > recvfrom fd=7(<4t>172.17.0.1:47566->172.17.0.2:80) size=1024
94683 23:13:04.246084084 1 nginx (14766) < recvfrom res=78 data=GET / HTTP/1.1..Host: localhost:8080..User-Agent: curl/7.58.0..Accept: */*.... tuple=NULL
sysdig 对容器也有比较好的支持,例如:
shell
$ sysdig -cl | grep container
topcontainers_cpu
                Top containers by CPU usage
topcontainers_error
                Top containers by number of errors
topcontainers_file
                Top containers by R+W disk bytes
topcontainers_net
                Top containers by network I/O
lscontainers    List the running containers

$ sudo sysdig -c lscontainers
container.type container.image container.name      container.id
-------------- --------------- ------------------- ------------
docker         nginx:1.17-alpi nginx               eda15d667287

$ sudo sysdig -c topcontainers_cpu
CPU%                container.name
--------------------------------------------------------------------------------
10.90%              host
0.00%               nginx
可以参考 Let there be light – Sysdig adds container visibility 查看更多介绍。